My Menu
Main Page
Downloads
Links
News
Search Engines
Documentation
About this Site
Privacy
Accessibility
Site Map
E-Mail Me
Scalar Vector Graphics
Vector graphics do not use the raster/bitmap method of defining each point in a graphic, rather the graphic is the result of mathematical equation/s performed in the browser. The display of each pixel is the result of a mathematical equation being performed.
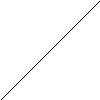
Scalar vector graphics, simply allow the mathematical equation to be displayed in any sized graphic without the loss of definition. Rather than the blockiness of the line shown in Fig XXX, the line will retain it's definition even when enlarged.


In its simplest from, to display a diagonal line from the bottom left of the graphic to the top right hand corner, a mathematical equation would be used which describes a straight line.
The equation for a line is y = ax + b in a 2 dimensional X-Y graph.

Here, the formula for this particular line is y = 1x + 0, or simply y=x.
If the Browser is empowered with the technology to display Scalar Vector Graphics (through a download plug-in, for example), rather than receive a long stream of data to display the line, the SVG enabled browser, can take the formula above, solve the mathematics for all points within the graphic, and then correctly display the result.
This reduces the amount of data required to create the graphic from:-
Raster - (0,0)=black, (1,0)=white,(2,0)=white,(3,0)=white,(4,0)=white,(5,0)=white … etc
To:-
SVG - y=x