Main Page
Downloads
Links
News
Search Engines
Documentation
About this Site
Privacy
Accessibility
Site Map
E-Mail Me
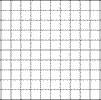
Briefly, we said that raster graphics consist of a matrix of pixels, and each pixel is ascribed a value, which represents colour.

In order for the Browser to render such a graphic from a web-site, it must be provided with all the relevant information to reproduce the desired grid on the screen. Ignoring any particular format, the browser must be told the size of the graphic and then the content.
The data stream from the web-site to the browser may resemble the following:-
Type=Graphic. Size=10x10. (0,0)=black, (1,0)=white,(2,0)=white,(3,0)=white,(4,0)=white,(5,0)=white … until every point has been defined.
Accordingly, the size of the data required to define a graphic increases exponentially as the size increases in terms of pixels. This is a bitmap graphic.
Various methods are employed to reduce the size of these graphics by using data compression, and are generally referred to in the graphic format, the most popular web-graphics being JPG or GIF.
These data compression methods work satisfactorily, however, are limited by the inherent nature of raster graphics, that is defining each individual point.
Also, these graphics are rather static in their display. Because each point has a fixed value, it cannot be readily altered to display, for example, the results of functions performed at the server, such as a search, or a display of raw data with a graphical interpretation, etc.